
Stop Losing Money
Start Trading with Confidence
The only TradingView indicator suite you need. Triple-confirmation signals, auto trendlines, zero guesswork, automated risk management. All for $7.99 a month. One good trade pays for the year. No more staring at charts wondering “is this the right trade?”
Already a subscriber? Manage Subscription →
Auto Trendlines & Long-Term Accumulation Bands
The two biggest upgrades we've shipped yet: trendlines drawn like a pro, and bands that show you where long-term money keeps stepping in.
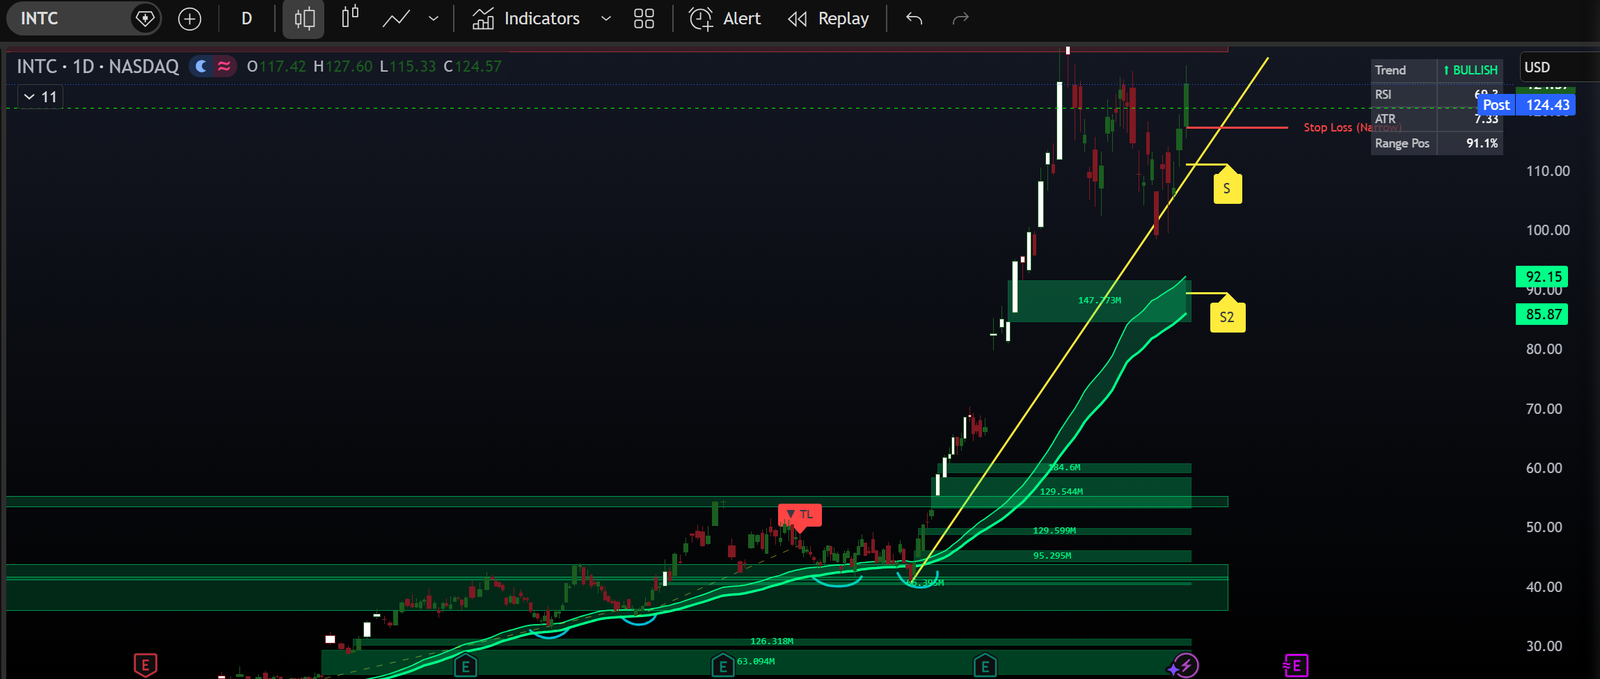
Long-Term Accumulation Bands — INTC daily rides the bands through the entire run from the $40s to $124
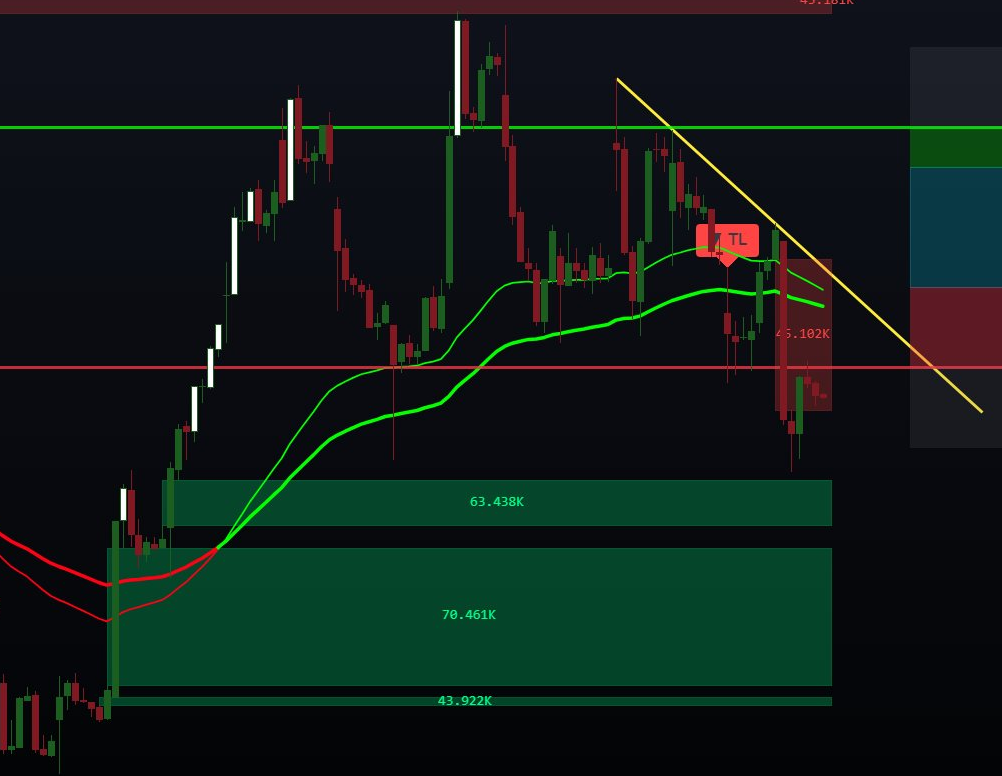
Auto Trendline break — the engine rides the lower highs down, price breaks through, and the TL marker prints
Long-Term Accumulation Bands
A dynamic band that tracks where long-term buyers keep stepping in. Price riding above the bands = healthy trend. Pullbacks into the bands that hold = accumulation — prime territory for swing and position entries instead of chasing highs.
Wick-Validated Auto Trendlines
The engine finds swing points and only keeps lines that ride the candle wicks — a line is rejected if any body or wick pokes through. Up to 5 lines per direction, with Conservative, Balanced, or Aggressive sensitivity.
Trendline Break Alerts
“Downtrend Line Broken” (bullish) and “Uptrend Line Broken” (bearish) fire the moment price clears a line plus the volatility buffer. Wire them to TradingView alerts for hands-free monitoring.
On-Chart Info Dashboard
Trend (BULLISH / BEARISH / NEUTRAL), RSI with extreme coloring, current ATR, and Range Position — the exact percentile of price within its recent range. Know if you're chasing highs before you click buy.
Signals Confluence Row
The Oscillator now shows how many of its eight component engines agree — e.g. “6 up, 1 down of 8”. High agreement = high conviction. A split board = stand aside.
You're Trading Blind
Most traders fail because they're making decisions based on feelings, not data. Sound familiar?
Conflicting Indicators
Your RSI says buy, but your MACD says sell. Your moving averages are crossed, but volume is weak. Which one do you trust? You freeze, miss the entry, or worse — enter anyway and lose money.
Gambling on Setups
You see a “perfect” pattern form. You enter with confidence. Then price immediately reverses and stops you out. Was it a fake breakout? Market manipulation? You'll never know because you had no confirmation system.
Death by Stop Loss
You place your stop too tight — stopped out by normal volatility. You place it too wide — big losses when you're wrong. Every timeframe needs different risk management but you're using the same settings everywhere.
Analysis Paralysis
You have 15 indicators on your chart. Volume, momentum, trend, volatility… You spend hours analyzing and by the time you decide, the move is over. Or you enter late and get caught in the reversal.
Choppy Market Whipsaws
The market goes nowhere. Your indicators flip-flop. Green, red, green, red. You take 5 small losses in a row before realizing you shouldn't be trading at all. Your account bleeds from death by a thousand cuts.
No Exit Strategy
You're in a winning trade. Should you take profit now or let it run? You hesitate. The trade reverses. You watch your profit disappear, turn into a loss, and hit your stop. Sound familiar?
The truth is: You don't have a talent problem. You have a system problem.
Meet Your Trading Edge
One Suite.
Three Indicators.
Zero Confusion.
TraderDaddy Pro is the only indicator system that combines trend analysis, volume pressure, and price action into ONE clear signal. No more contradictions. No more guesswork.
- Oscillator — Shows you the BIG PICTURE trend (bullish, bearish, or stay out)
- Volume — Shows you SHORT-TERM buying/selling pressure in real-time
- Overlay — Shows you exact entry zones, stop losses, and profit targets
- Triple Confirmation — Only trade when all three agree (filters out 80% of bad trades)
- Auto-Calibrated — Automatically adjusts to your timeframe (scalping to swing trading)
Trading Made Simple
Follow the system. Trust the signals. Take profits.
Wait for Alignment
Both Oscillator and Volume must show the same direction. If they disagree, you wait. This single rule prevents 80% of losing trades.
Enter at Confirmation
When both indicators turn green (or red), the system gives you a clear entry signal. No analysis paralysis. No second-guessing.
Mark Your Stop Loss
The Overlay shows you exactly where to place your stop based on current volatility. Mark it once at entry and respect it. No moving stops.
Take Profits Systematically
Use the built-in Fibonacci levels, volume gaps, or ATR profit targets. Take partial profits at each level. Let winners run.
One indicator. Trend, volume,
and structure on one chart.
Triple Confirmation System
Eight component engines fused into one Oscillator + real-time Volume pressure = only trade when everything aligns. The new Signals row shows exactly how many engines agree (e.g. “6 up, 1 down of 8”). No more conflicting signals.
Auto Trendlines (NEW)
The engine finds swing points and draws wick-validated trendlines like a pro — up to 5 per direction. Conservative, Balanced, or Aggressive sensitivity. Break alerts fire the moment price clears a line.
Long-Term Accumulation Bands (NEW)
A dynamic band that tracks where long-term buyers keep stepping in. Price riding above the bands = healthy trend. Pullbacks into the bands that hold = accumulation — prime swing and position entries.
Timeframe Adaptive
Automatically calibrates for 2-minute scalping all the way to monthly swing trades. One indicator suite for every trading style.
Built-in Risk Management
ATR-based stop losses and take profit levels that adapt to market volatility. Choose Wide, Narrow, or Custom multiplier presets. Never guess where to place your stops again.
Four Analysis Modes
Fibonacci (golden pocket levels & extensions), Zones & Pivots (auto S/R zones), Both for maximum confluence, or None for a clean chart. One overlay, complete flexibility.
On-Chart Info Dashboard (NEW)
A compact panel showing Trend, RSI with extreme coloring, current ATR, and Range Position — the exact percentile of price within its recent range. Know instantly if you're chasing highs or buying lows.
Volume Gap Detection
Identifies Fair Value Gaps (FVGs) that act as price magnets. These gaps fill with 80%+ accuracy — perfect for entry and exit targets. Each gap shows the exact share volume traded, and the new Gap Sensitivity control lets you filter for only the monsters.
Volume Regime Alerts (NEW)
The Volume panel now rates every bar NORMAL, ELEVATED, HIGH, or EXTREME versus average volume. Extreme Volume Spike (3x+) and High Volume (2.5x+) alerts catch institutional activity the moment it prints.
Anti-Fakeout Filters
Body strength checks, close confirmation, MA filters, and market close lockouts prevent you from entering choppy, low-probability setups.
RSI Candle Warning System
When RSI goes extreme — above 85 (overbought) or below 15 (oversold) — your candles automatically turn white. A built-in “don't touch this trade” signal. No separate RSI panel to watch.
Trend Continuation Signals
Catch pullbacks in established trends. The Volume indicator shows you when to “buy the dip” or “sell the rip” with precision timing.
Smart S/R Zone Detection
Automatically draws dynamic Support & Resistance zones. Green = support, red = resistance, yellow = caution (you're inside a zone). Pivot fallback (Traditional, Fibonacci, Woodie, Classic, DM, or Camarilla) fills any gaps.
Divergence Detection
Bullish divergences flag potential reversals on 1H+ charts — and NEW bearish divergences are now available on 4H and higher. Every divergence type has its own alert.
Clean, Professional UI
Dark & light mode themes. Mobile friendly. Info panels that show exactly what you need: Trend, Strength, MA Filter. No clutter.
Set-and-Forget Simplicity
All settings are pre-optimized for each timeframe. Just add to your chart and start trading. No complex configuration needed.
See Real Trades. Real Results.
Watch how the triple-confirmation system identifies high-probability setups and keeps you out of choppy markets.
The Triple-Confirmation System
Simple rules. Clear signals. No more guessing. Here's exactly how to trade with TraderDaddy Pro.
The Golden Rule
Both the Oscillator and Volume must AGREE before you enter.
If they disagree, you DO NOT TRADE. This single rule prevents 80% of losing trades.
Bullish Entry (Long)
- ✓Oscillator is GREEN
Shows “BULLISH ⬆” in info panel
- ✓Volume line turns GREEN
Shows “BUYERS IN CONTROL”
- ✓BONUS: Green Volume Blocks
Strong bullish confirmation
Bearish Entry (Short)
- ✓Oscillator is RED
Shows “BEARISH ⬇” in info panel
- ✓Volume line turns RED
Shows “SELLERS IN CONTROL”
- ✓BONUS: Red Volume Blocks
Strong bearish confirmation
How We Keep You From Getting Chopped Up
The #1 killer of trading accounts is choppy, sideways markets. Here's how we protect you:
❌ Conflicting Signals = NO TRADE
If Oscillator says bullish but Volume says bearish (or vice versa), the system tells you to WAIT. No entry. No loss.
⏸️ Neutral Zone Protection
When the Oscillator is in the gray/blue NEUTRAL zone, it means the market is choppy. The system won't give you entry signals. You stay cash.
🔍 Built-in Filters
Body strength checks, close confirmation, volume acceleration detection, and market close lockouts automatically filter out low-probability setups.
🎯 Only High-Probability Plays
By requiring triple confirmation (Oscillator + Volume + Overlay levels), you only enter when the odds are heavily in your favor.
Catch the Pullbacks
Already in a trend? Use Volume to time perfect re-entries on pullbacks.
📈 Buy the Dip
When: Oscillator stays GREEN (uptrend intact)
Watch for: Volume flips RED (pullback), then back to GREEN
→ Enter when Volume turns GREEN again
📉 Sell the Rip
When: Oscillator stays RED (downtrend intact)
Watch for: Volume flips GREEN (bounce), then back to RED
→ Enter when Volume turns RED again
When to Take Profits
Multiple exit strategies to fit your trading style
📊 Method 1: Use Overlay Targets
Take profits at Fibonacci levels (0.5, 0.618, 0.786), Volume Gaps, and previous swing highs/lows. These act as natural resistance zones.
🎯 Method 2: Use Built-in Take Profit Levels
The system shows you TP1, TP2, and TP3 automatically. Take 1/3 at each level. Move your stop loss higher each time to lock in profits.
⚡ Method 3: Volume Reversal
Exit when Volume flips color. In a long: exit when Volume turns RED. In a short: exit when Volume turns GREEN. Lets you ride trends longer.
🔄 Method 4: Oscillator Trend Change
For longer-term trades, exit when the Oscillator changes zones (bullish → neutral/bearish or vice versa). More conservative approach.
CRITICAL: Stop Loss Rules
⚠️ The built-in stop loss line MOVES with every candle
When you enter a trade, you MUST mark your stop loss at that moment:
- Look at the RED stop loss line on your entry candle
- Draw a horizontal line at that exact price
- Label it “STOP LOSS - [Entry Time]”
- This is YOUR stop — it does NOT move
- Exit if a candle CLOSES past your marked line
Never risk more than 1% of your account per trade
This lets you survive losing streaks and stay in the game long enough for winners to compound.
See The Indicators In Action
Actual entries from the indicator, not demo charts.
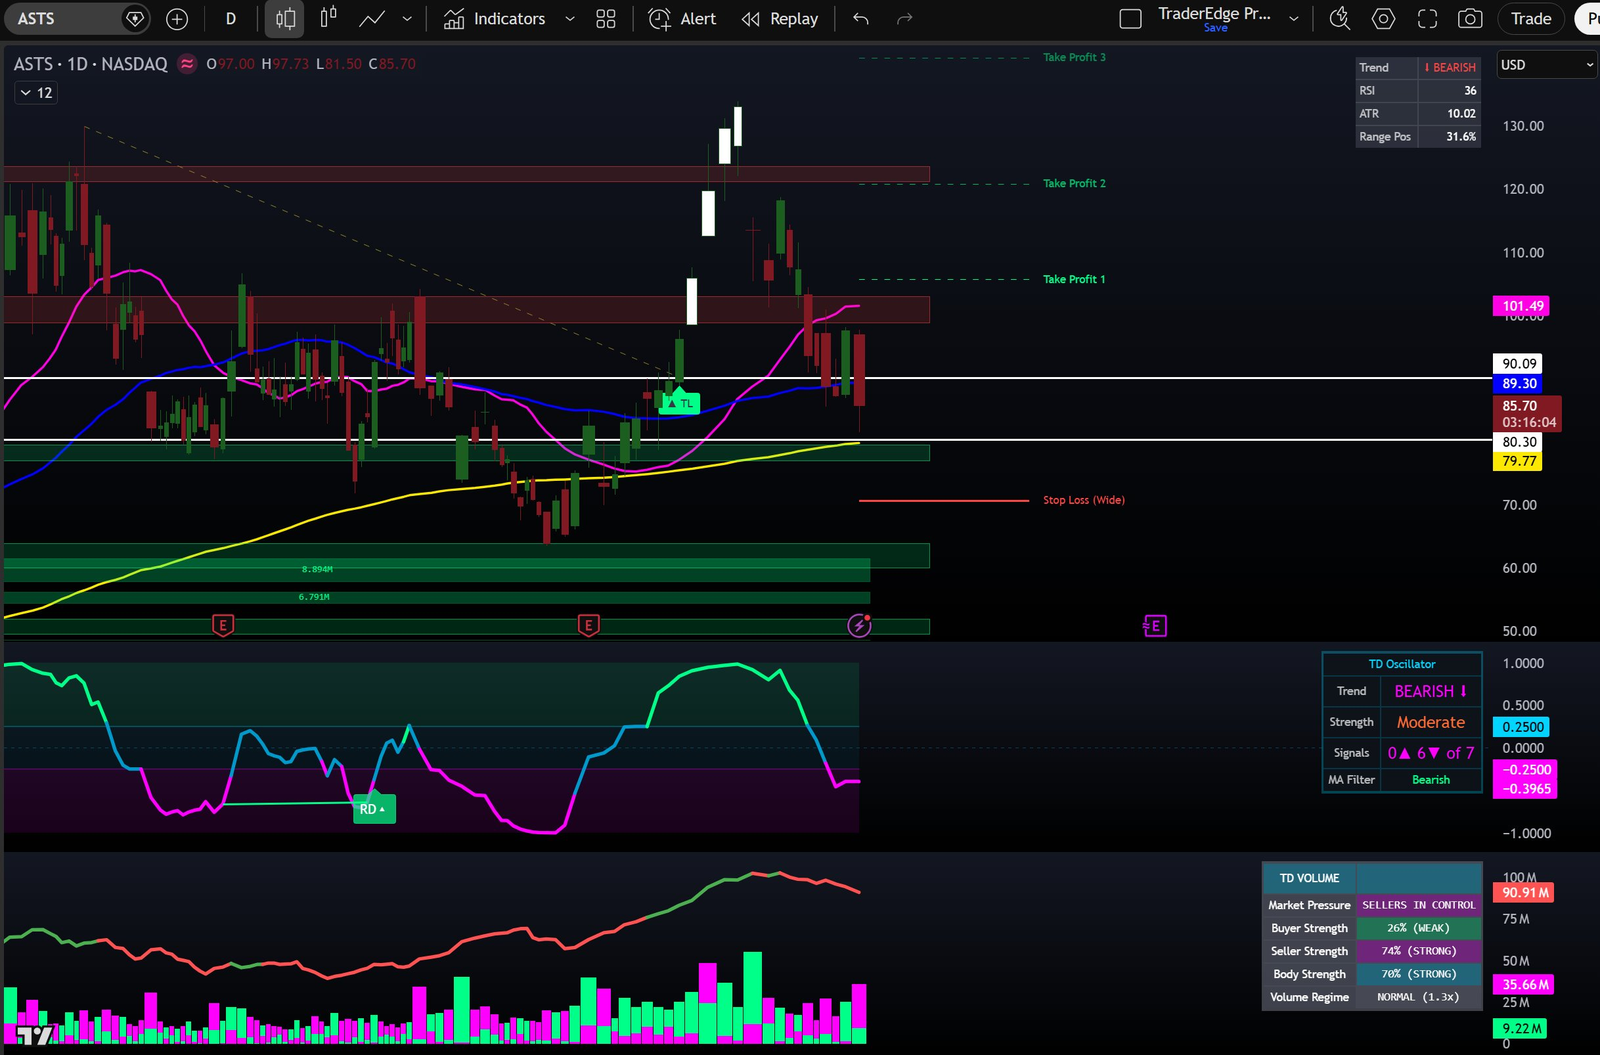
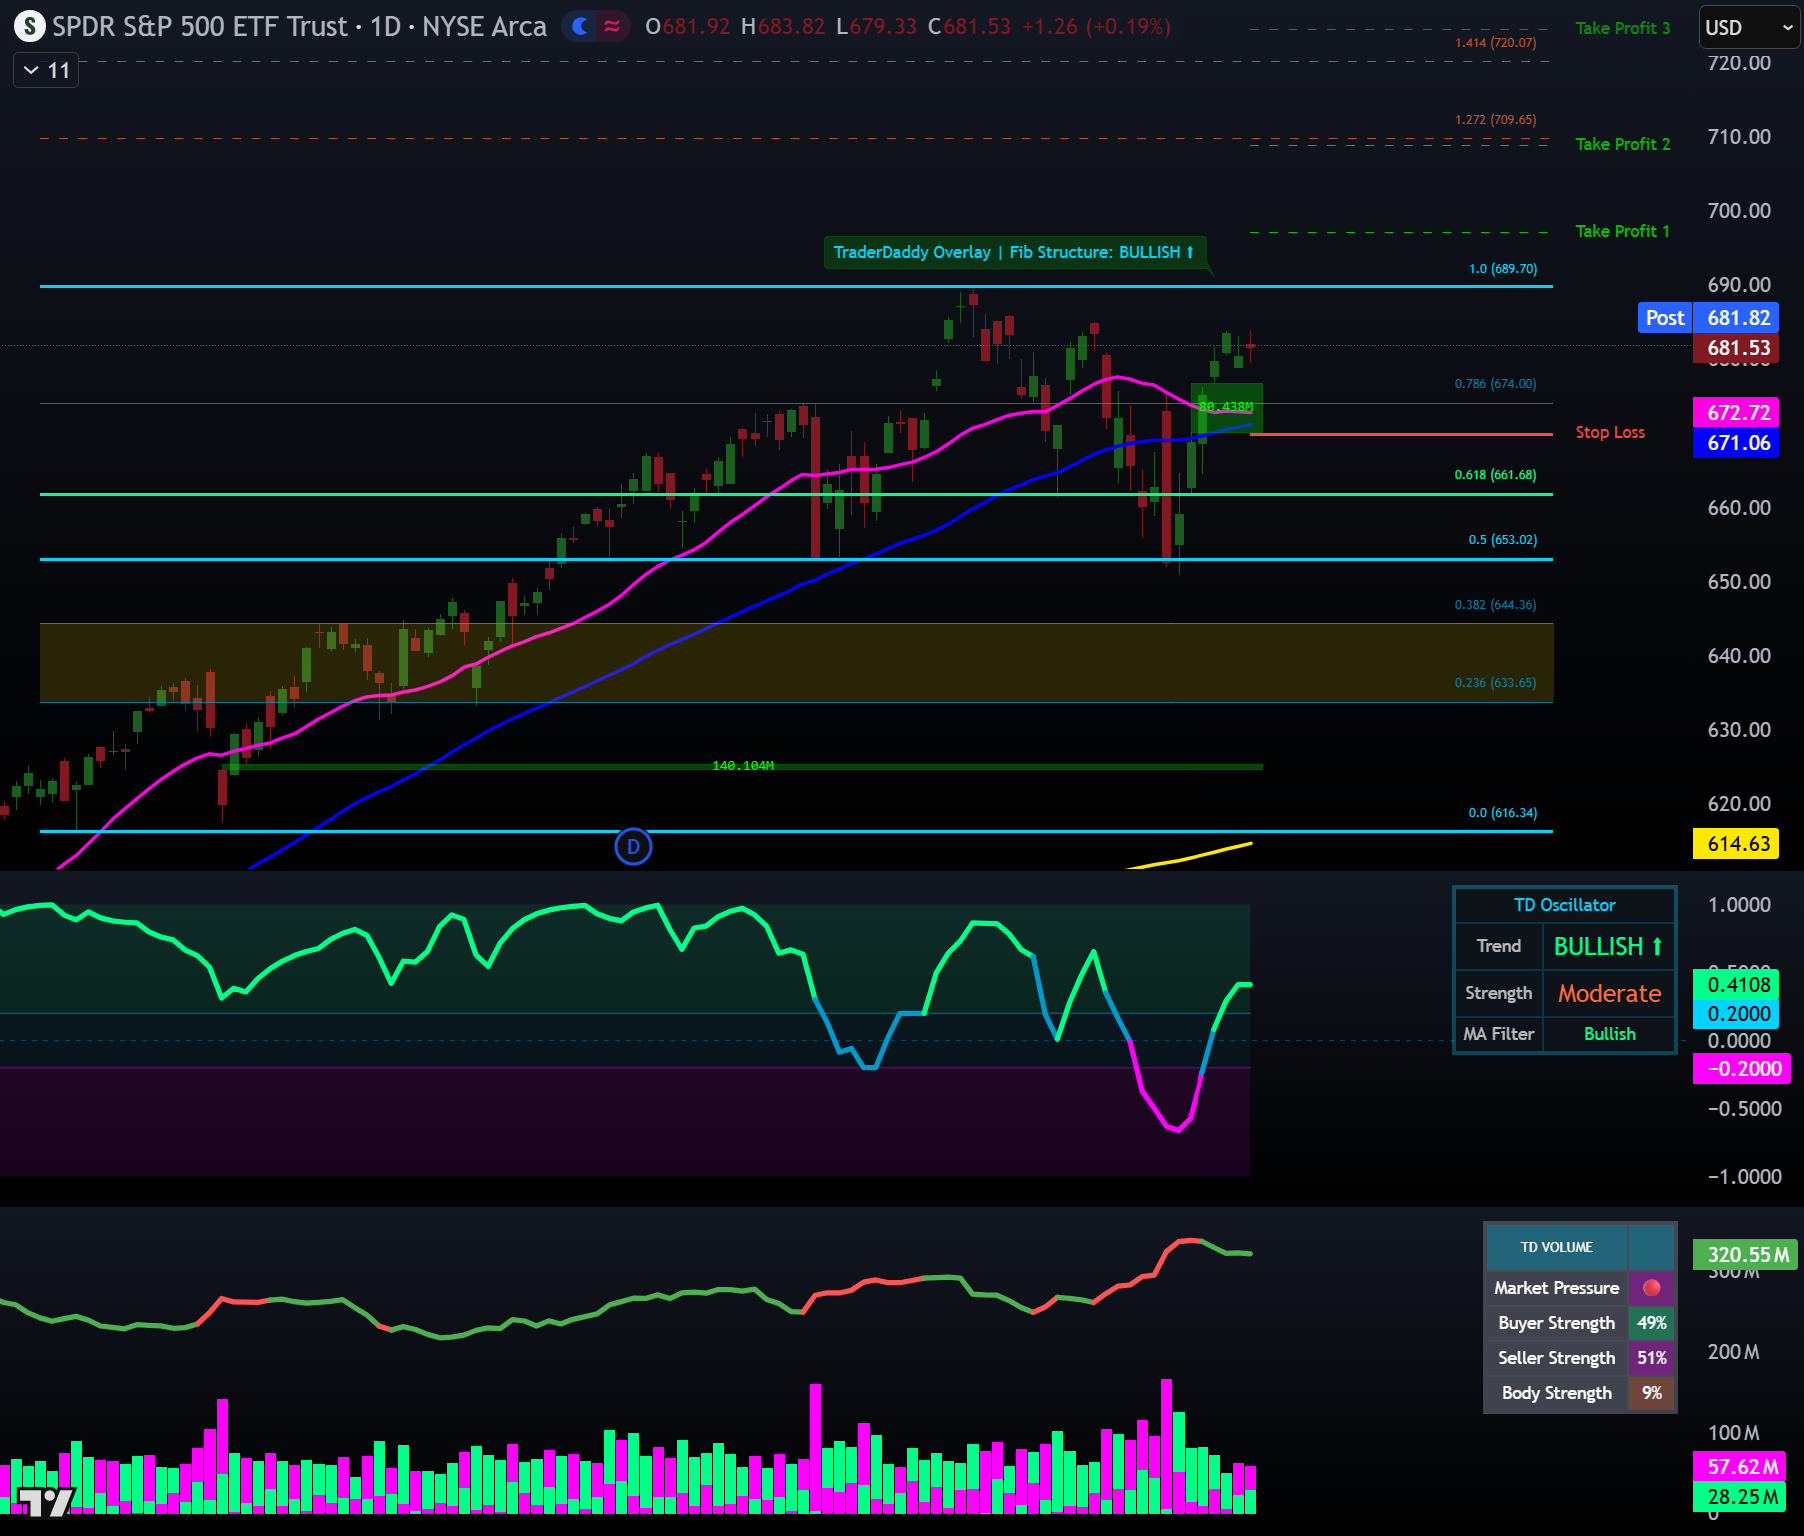
Complete Setup
The full v4 suite on one chart — Overlay zones, take profits, trendline break marker, Dashboard, Oscillator and Volume all agreeing
Auto Trendline Break
The engine anchors at the swing high and rides the lower highs down — price breaks through and the TL marker prints
Long-Term Accumulation Bands
INTC daily riding the bands from the $40s to $124 — every pullback into the bands was a buying opportunity
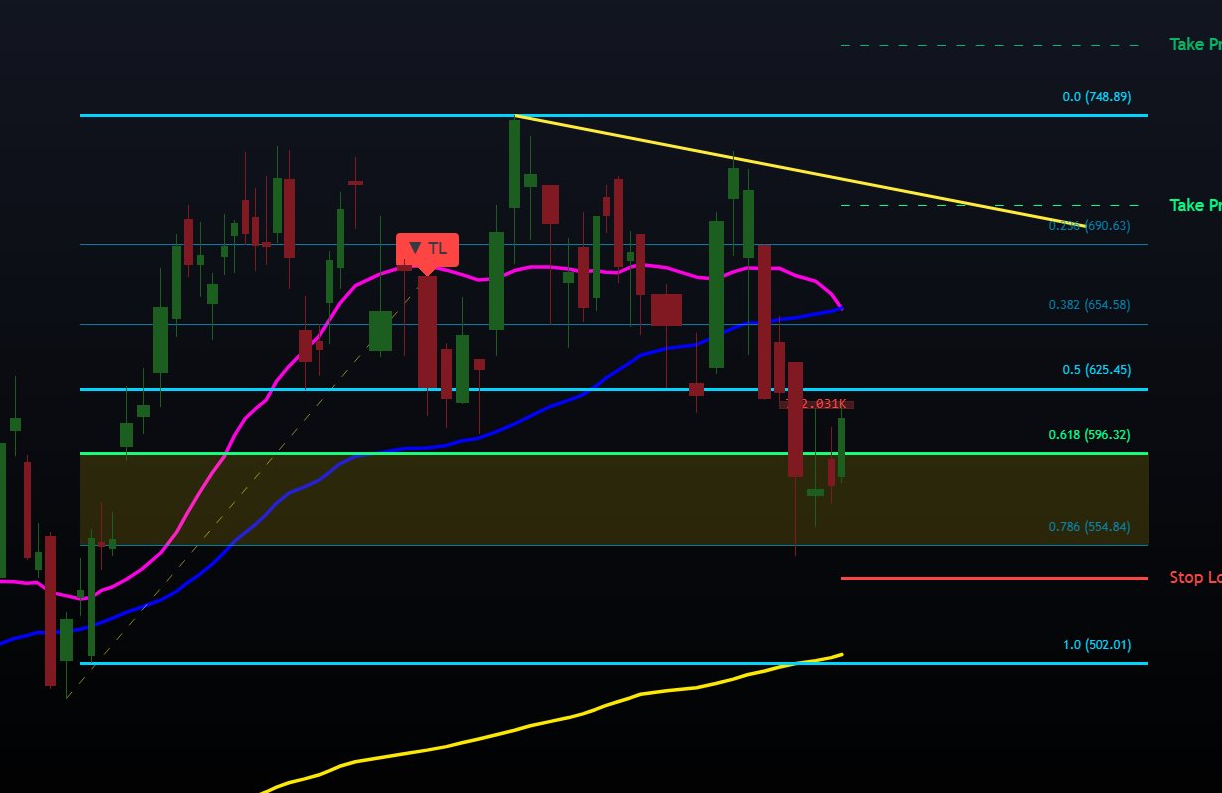
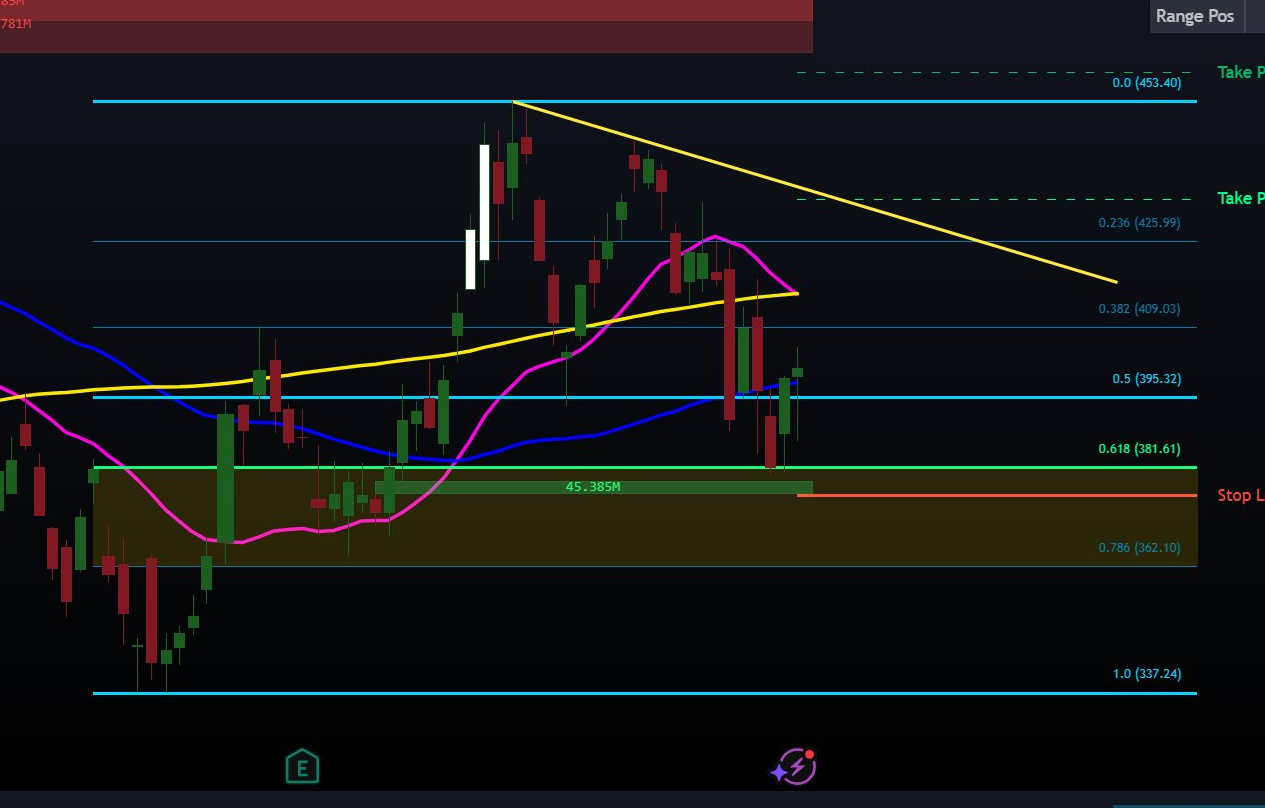
Golden Pocket Reversal
Price retraces into the 0.618–0.786 Golden Pocket and reverses higher — the textbook bounce
Volume Gaps & MA Stack
A green gap box (45.4M shares) reinforcing support, red gap resistance overhead, and the 20/50/200 MA stack mapping the trend
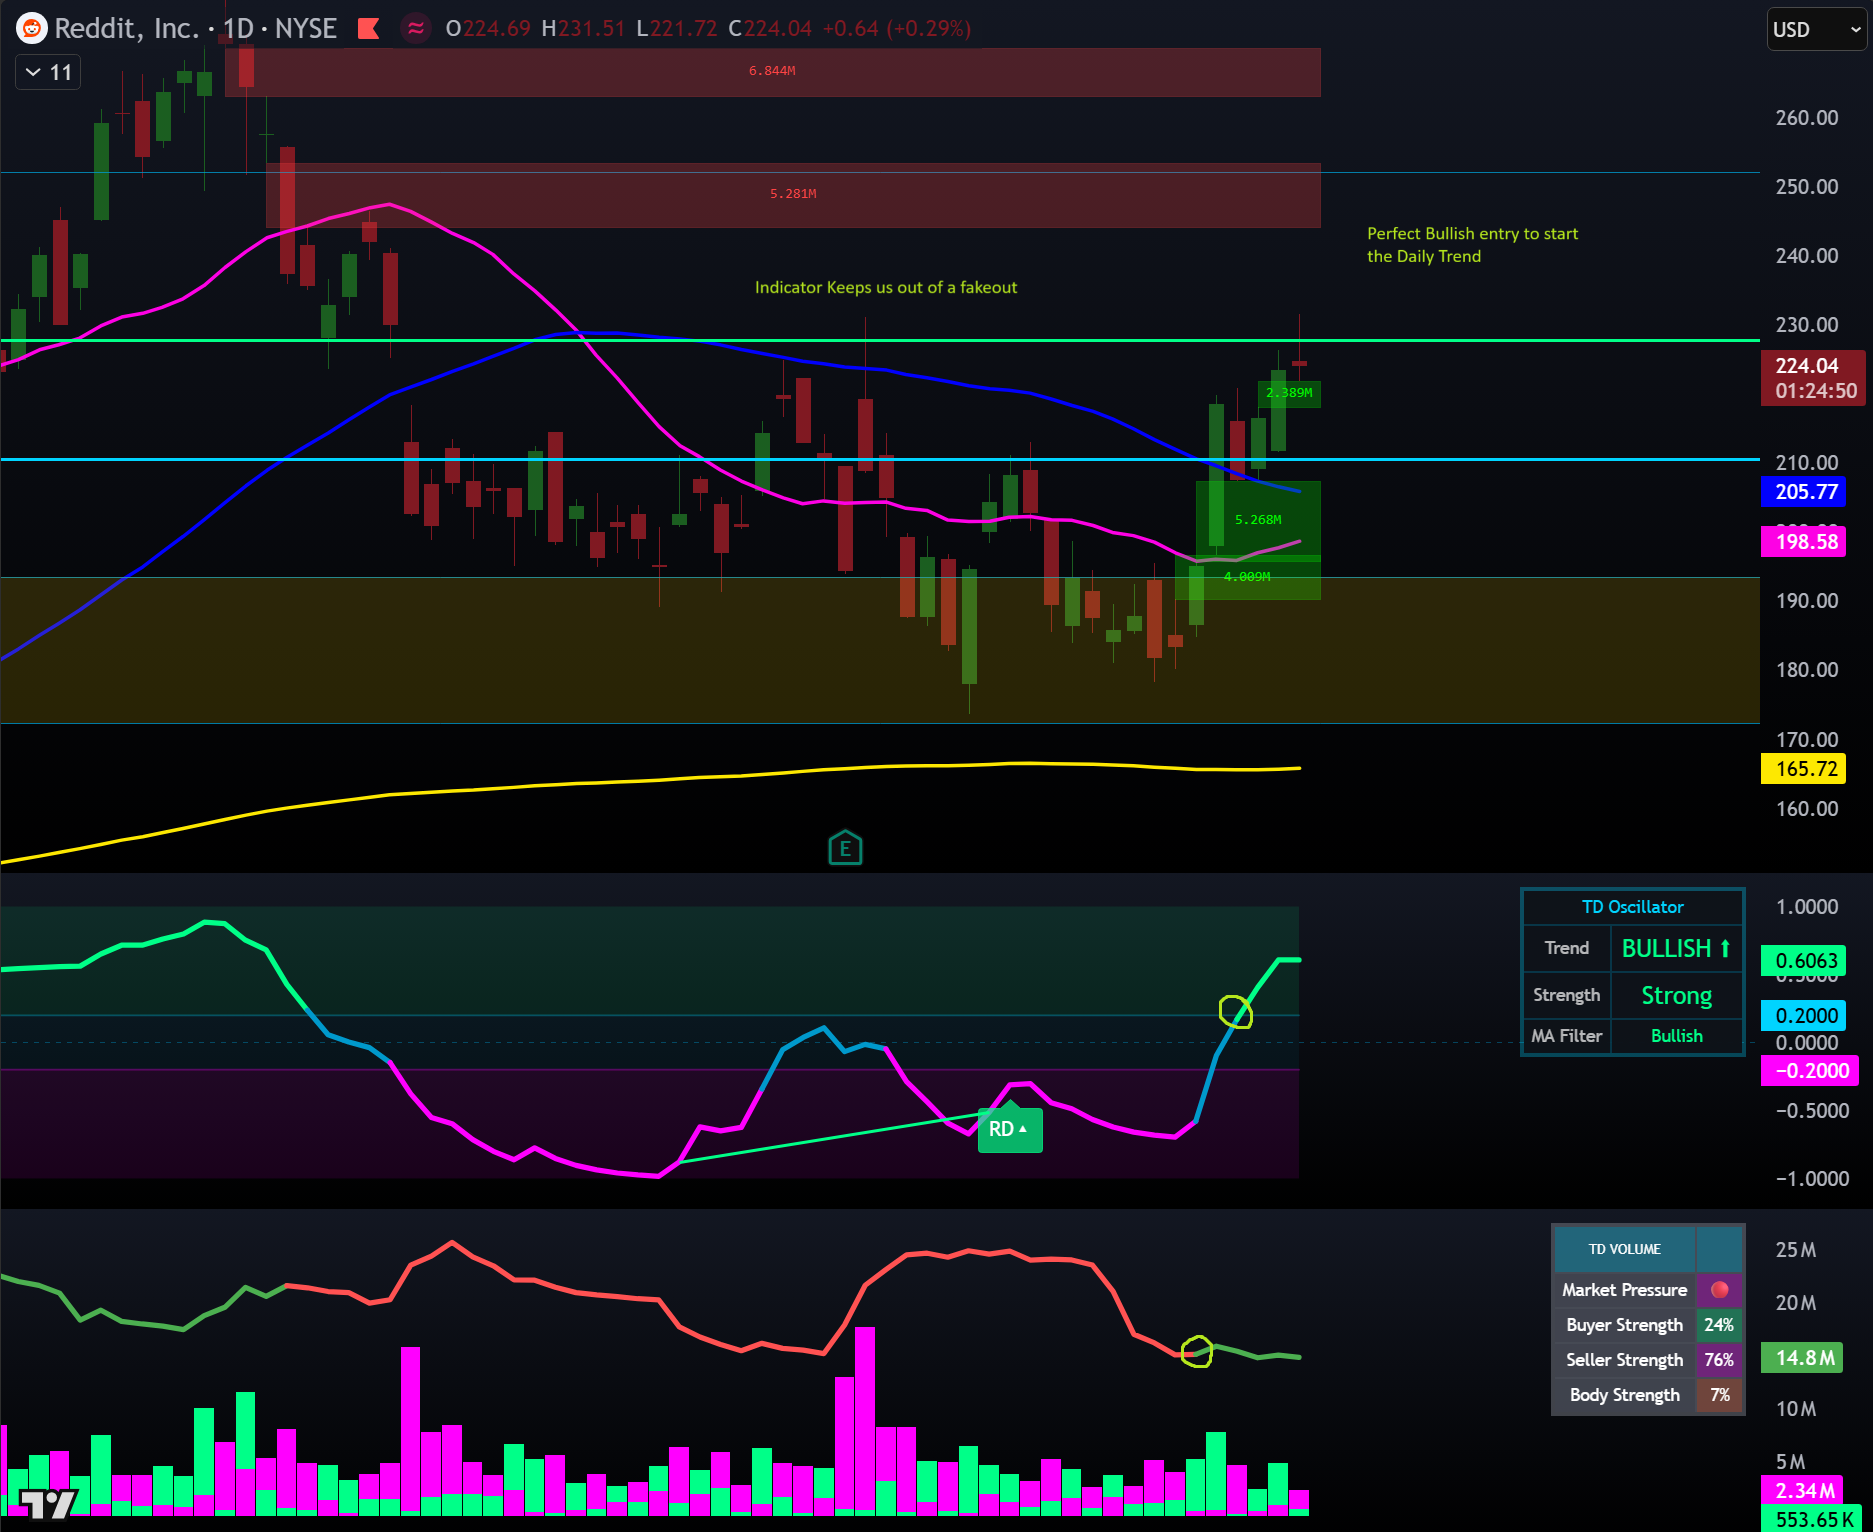
Bullish Entry Signal
Both Oscillator and Volume turn green — perfect entry confirmation
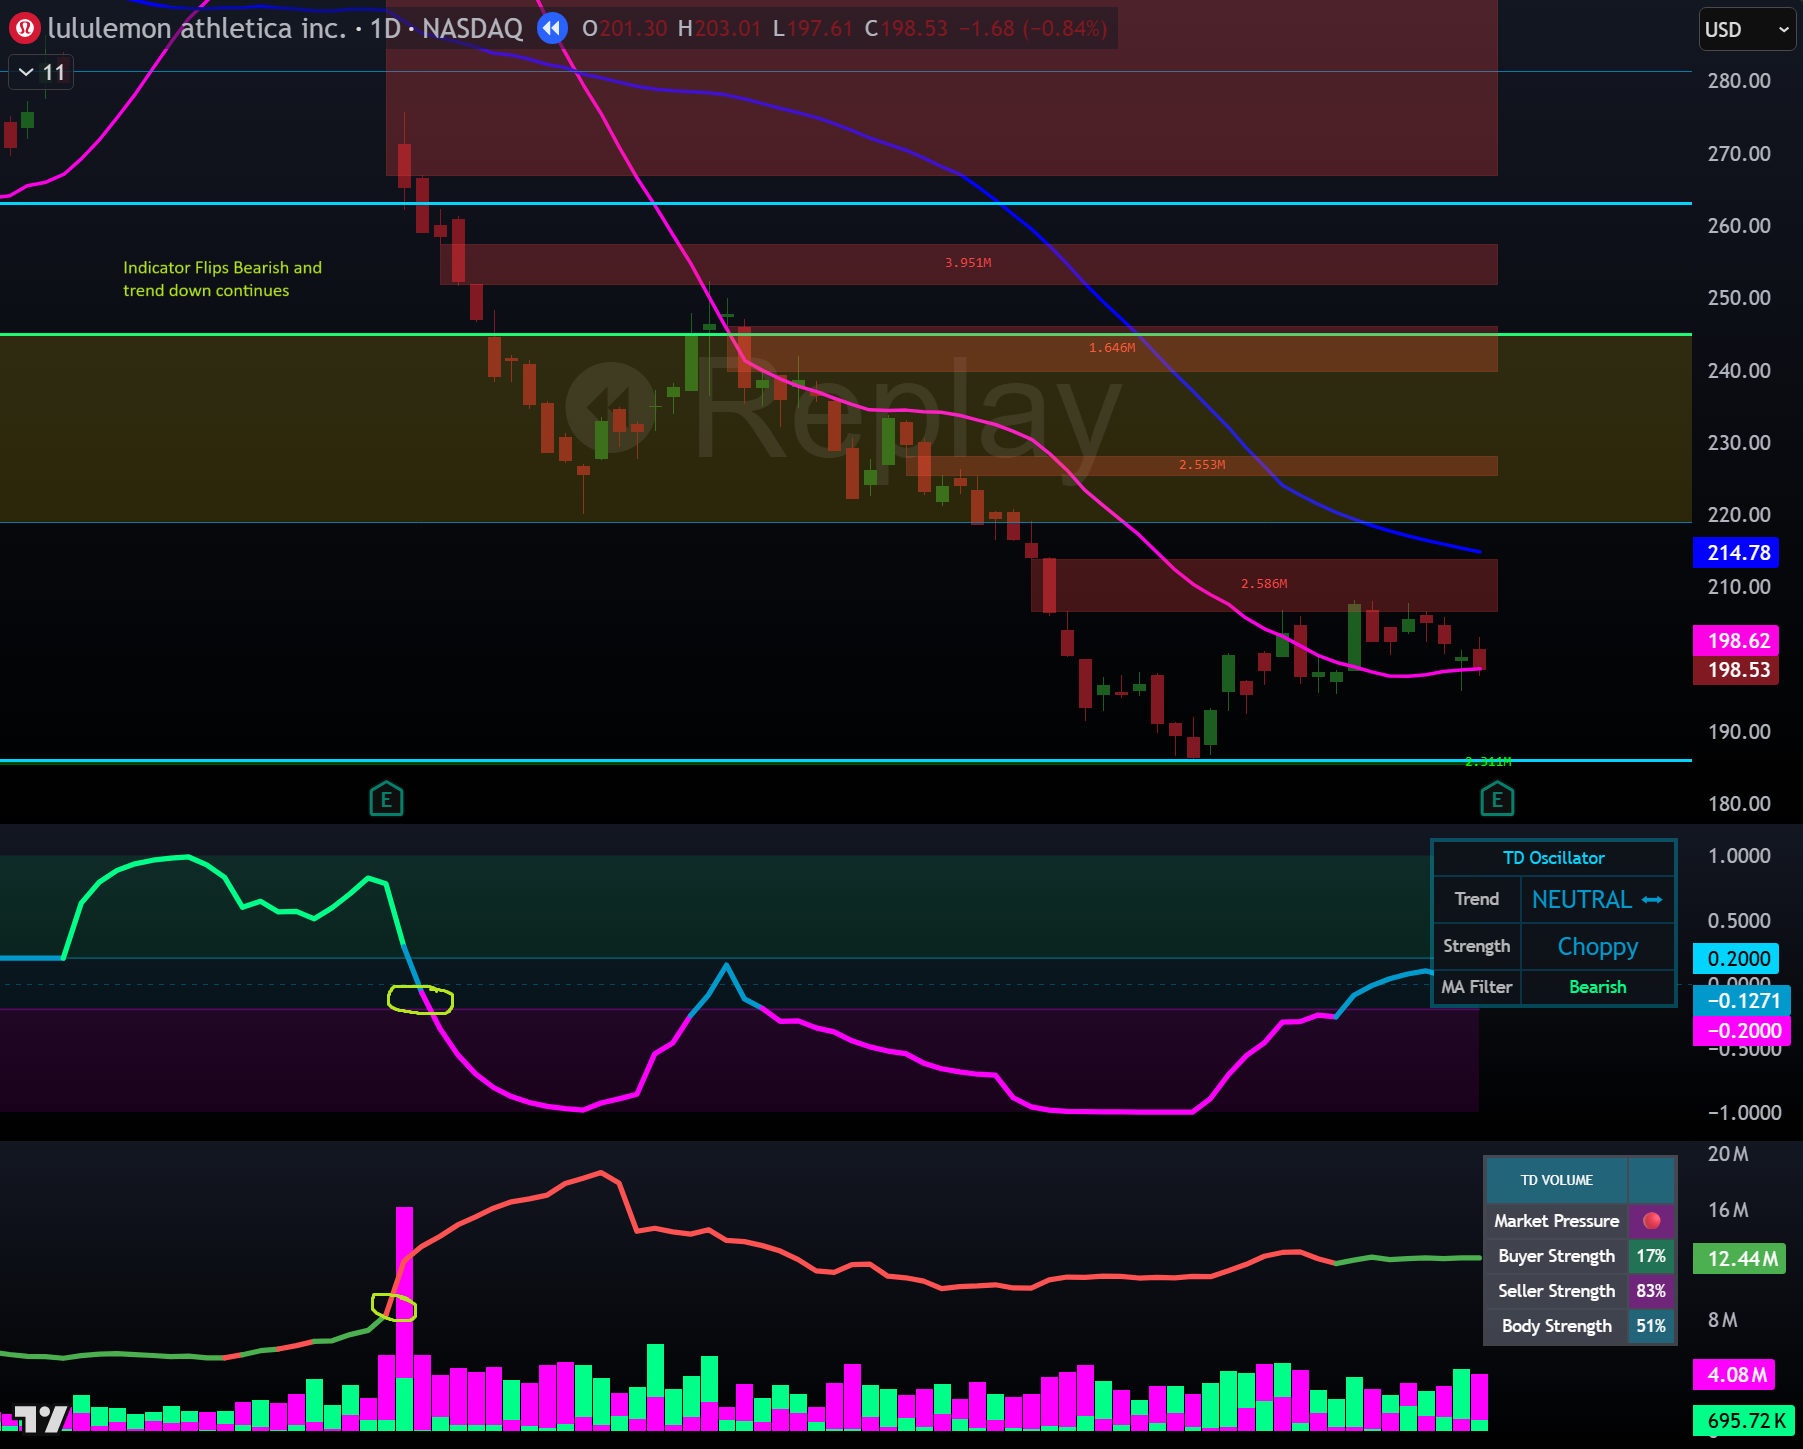
Bearish Entry Signal
Both indicators turn red — clear short signal
ATR Risk Management
Automatic stop loss and 3 take profit targets based on volatility — Wide, Narrow, or Custom presets
Zones & Pivots Mode
Auto support/resistance zones plus closest pivot levels — no manual drawing ever needed

These are real charts from real traders. This is what you'll see when you use TraderDaddy Pro.
I Want This For $7.99/Month →Real Traders. Real Results.
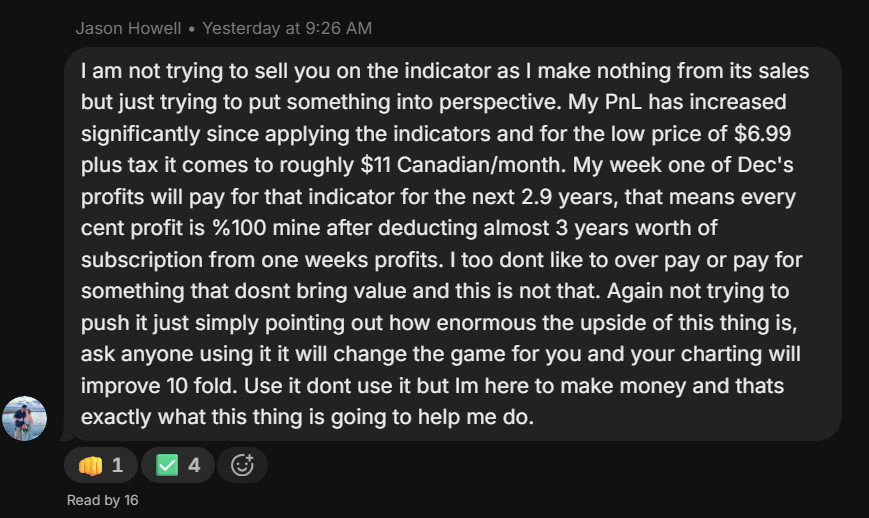
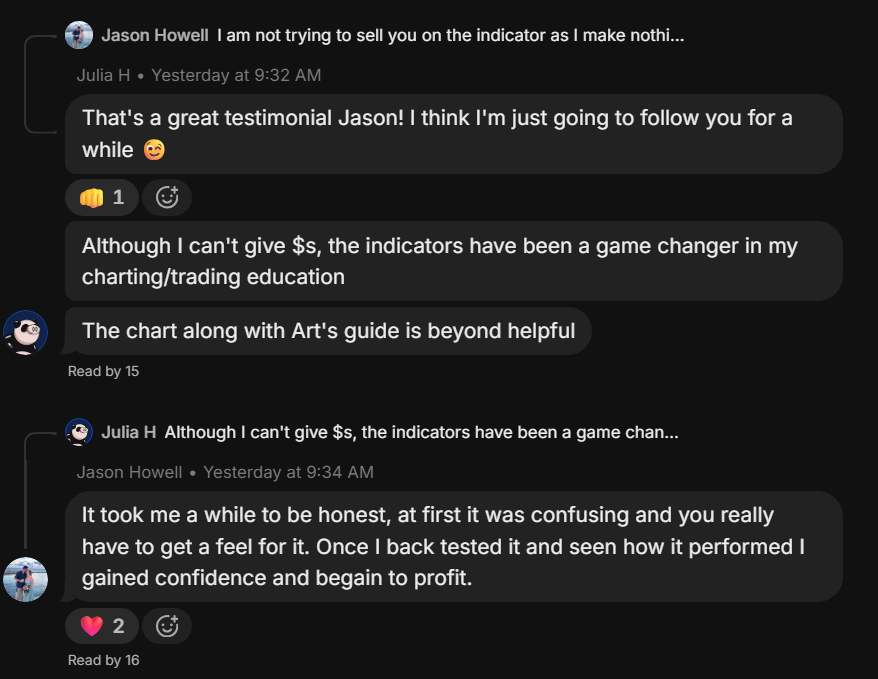
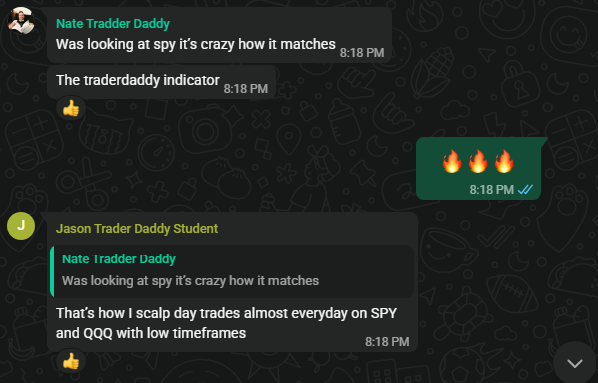
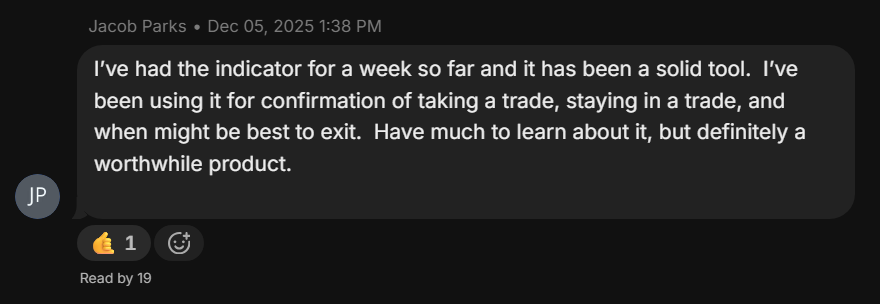
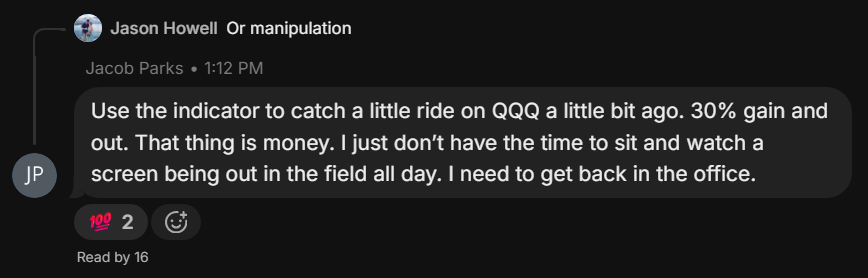
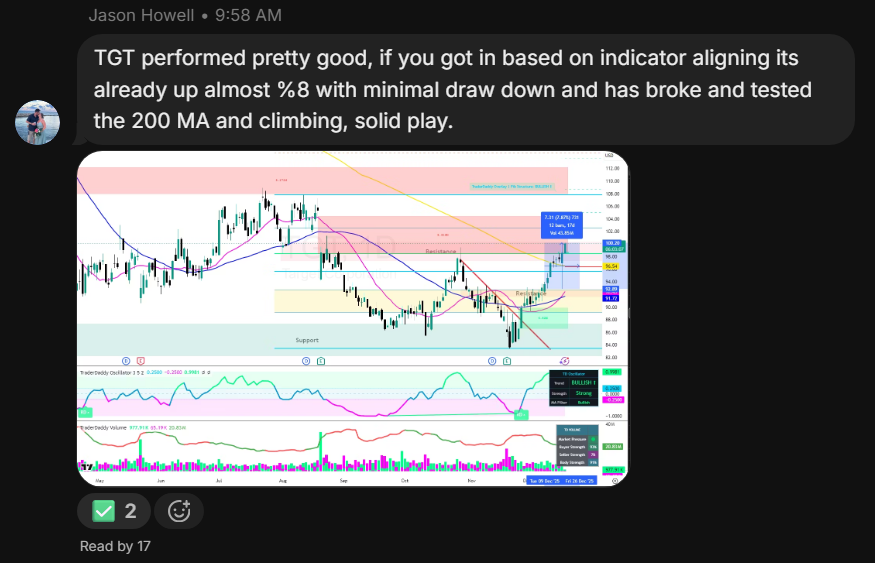
Unfiltered screenshots from our community. These are real people, real messages, real profits.


$7.99/Month. Seriously.
Less than one lunch a month. Cancel anytime. No setup fees. No hidden charges. Just professional trading indicators.
Let's Be Real About The Value Here
One bad trade will cost you $50–$500. The entire indicator suite is less than a cup of coffee a month — just $7.99.
If this doesn't pay for itself in the first week, you're not following the system.
⚠️IMPORTANT: How to Access Your Indicators
After you purchase the indicator, it can take up to 24 hours for it to show up in your TradingView.
To access your new indicators, go to:
TradingView → Indicators → Invite-Only
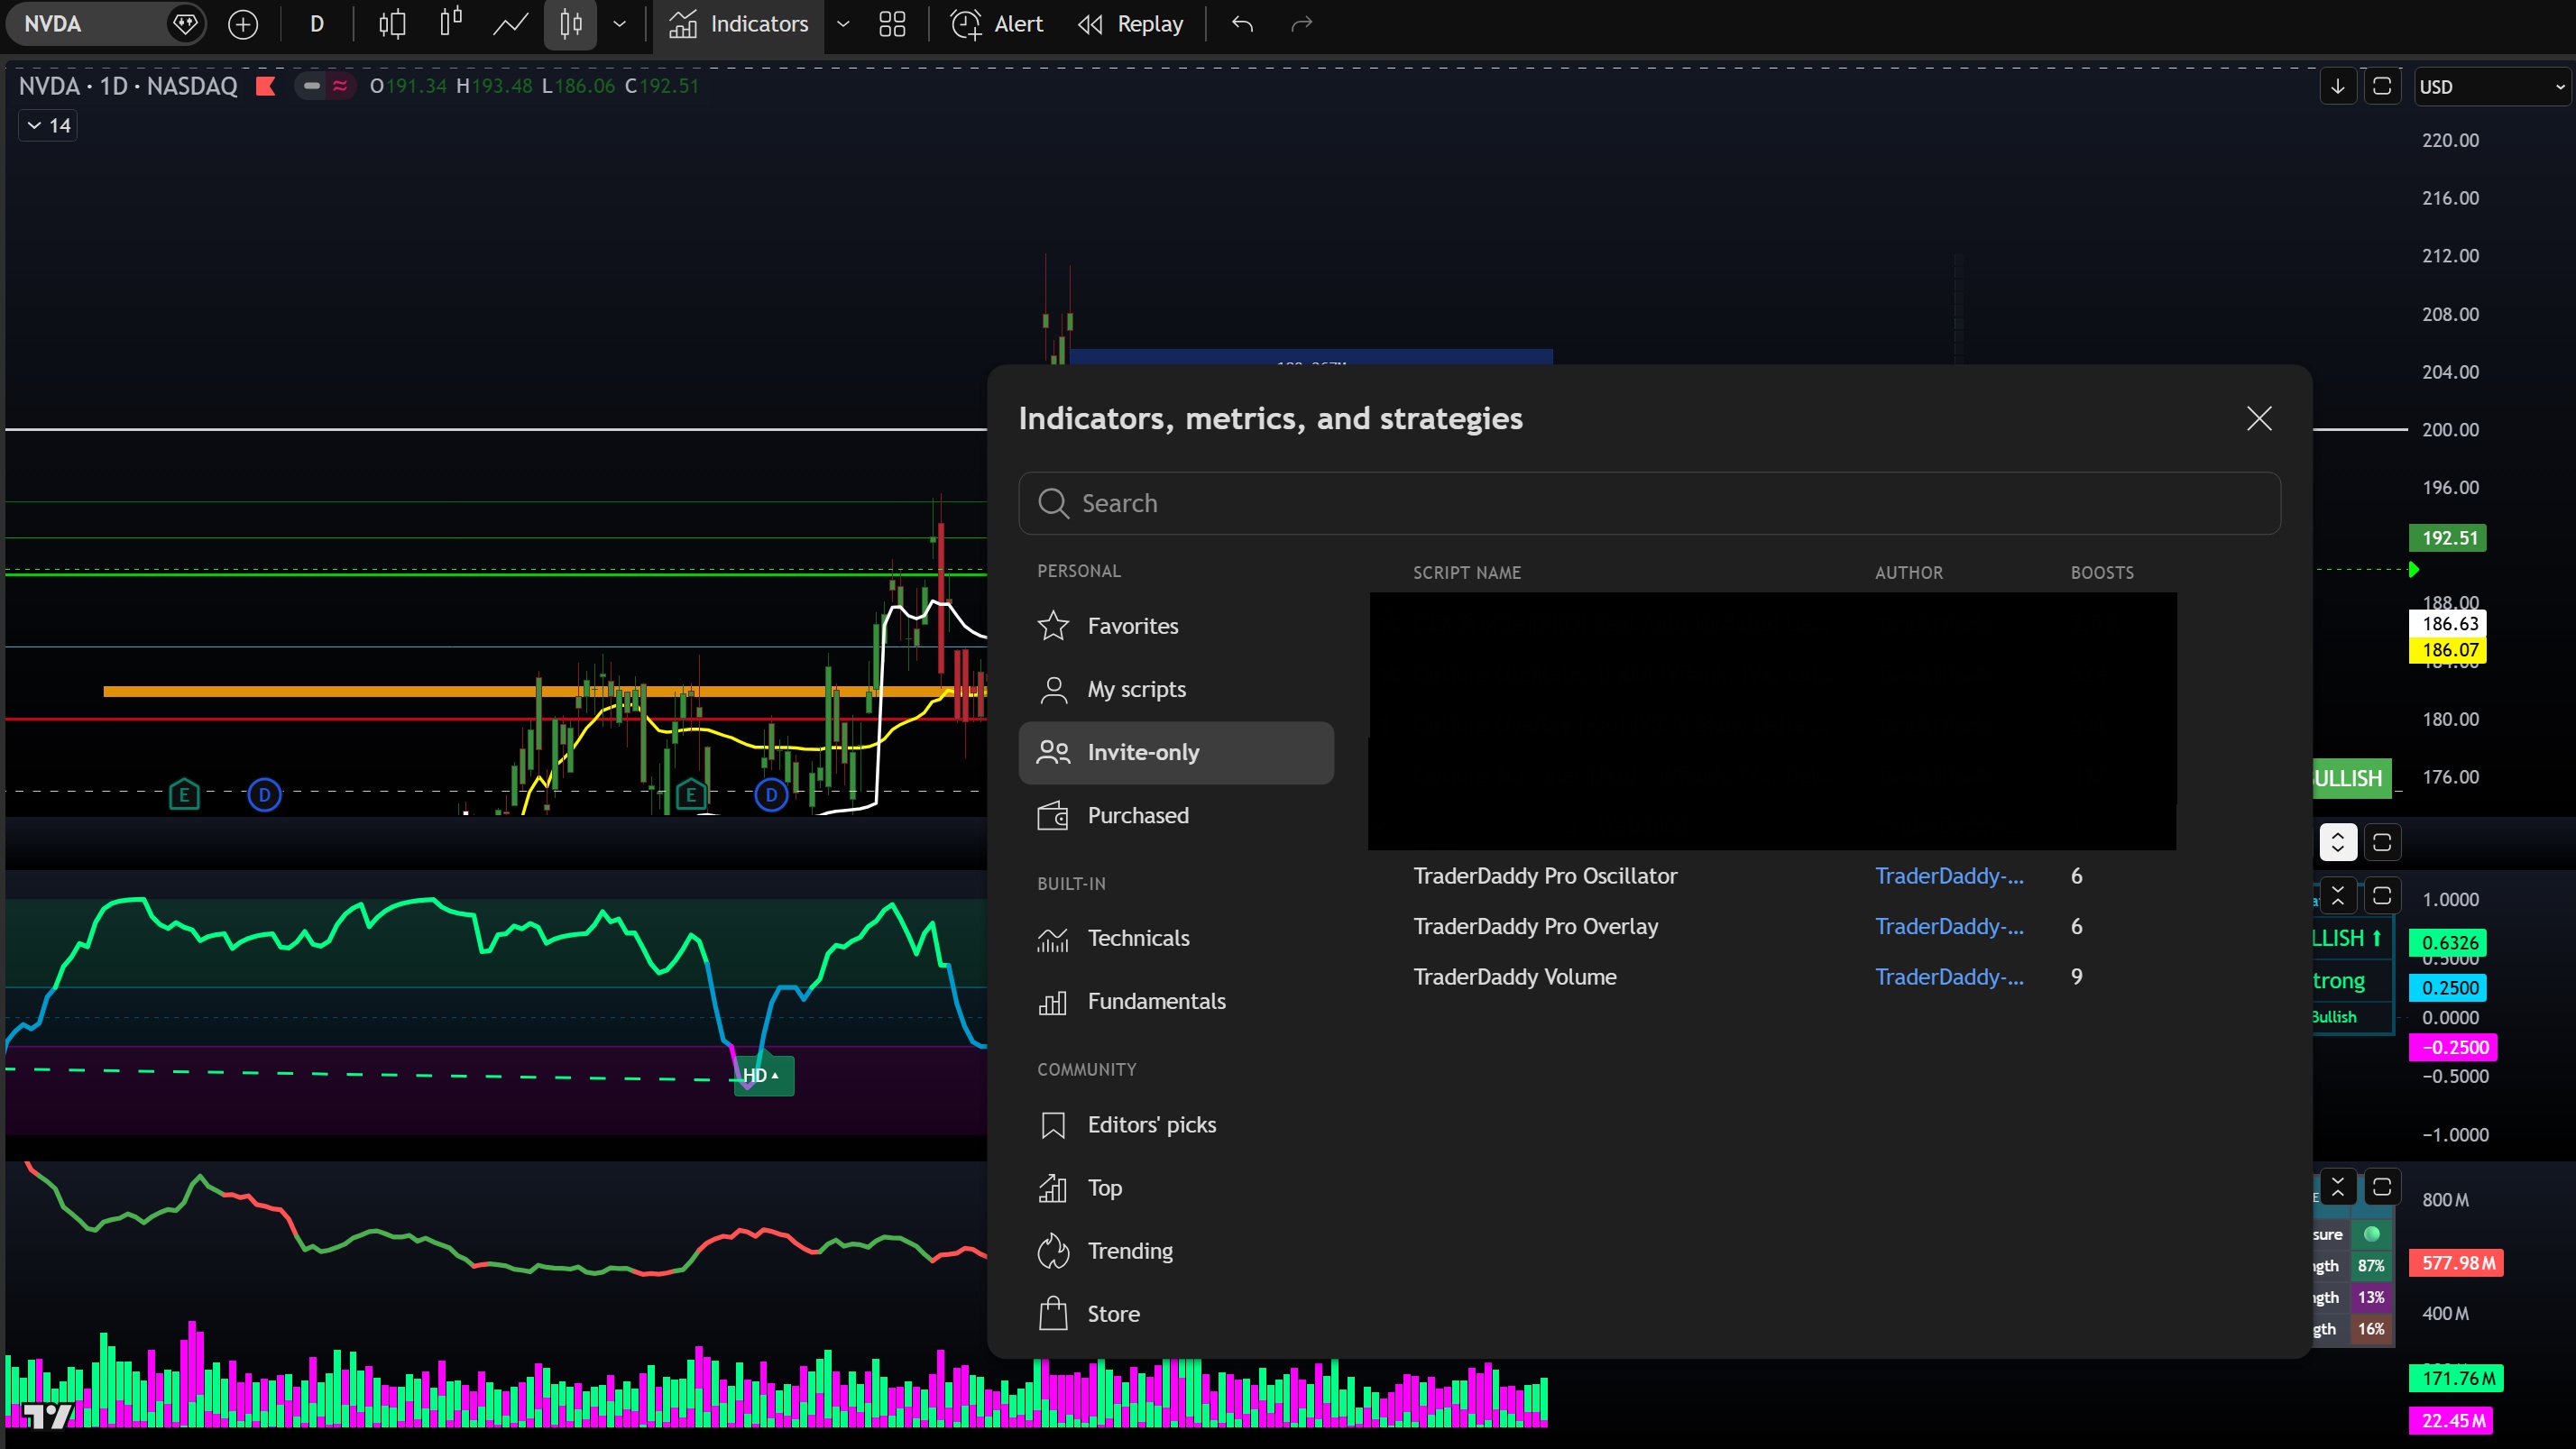
- TraderDaddy Pro Overlay Indicator
- TraderDaddy Pro Oscillator Indicator
- TraderDaddy Volume Indicator
- Complete Suite Guide — Edition 2 (PDF)
- TradingView Invite & Setup
- Lifetime Updates
- Email Support
- Cancel Anytime (No Contracts)
🤯 That's $7.99 for indicators worth $500+
One losing trade costs you 10x more than a month of TraderDaddy Pro.
It's literally stupid not to have this.
Instant delivery via TradingView • All payments secured by Stripe
Common Questions
Does this work for stocks, forex, crypto?+
What timeframes can I use?+
Is this a subscription or one-time payment?+
I'm a complete beginner. Will this work for me?+
Do the indicators repaint?+
How do I install it?+
What if it doesn't work for me?+
Can I use this with other indicators?+
Do I need TradingView Premium?+
Stop Trading Blind.
Start Trading with Edge.
Join 100+ traders who stopped gambling and started following a proven system.
Start for $7.99/Month →